Go to SendWork
— Free for 7 Days
Full access
Full access

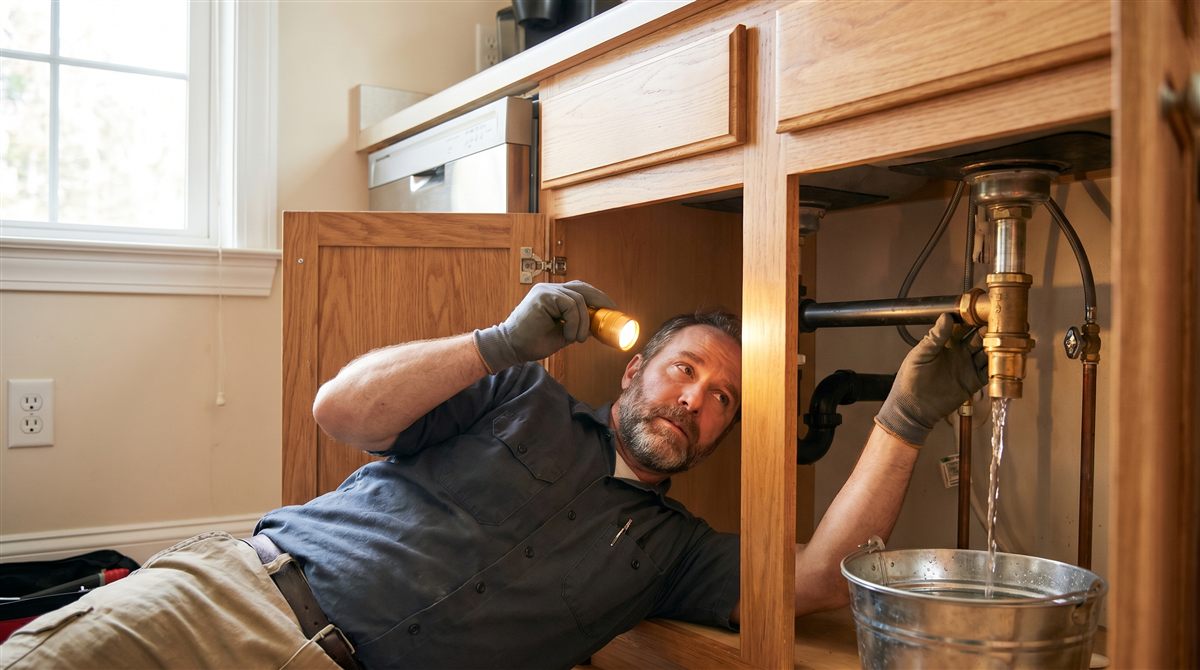
A callback feels like bad luck on the day it happens. You go back, you make it right, you eat the time, and you move on. But every return trip is data, and across a month or a quarter the pattern adds up to one of the most honest numbers in your business. Your callback rate — the share of jobs you have to return to and fix — is quietly telling you whether your field quality is real or just self-reported.
Most operators never measure it, because each callback feels like a one-off. It is not. A callback rate that creeps upward eats your margin twice: once on the unpaid return visit, and again on the reputation you never see leaking away. The good news is that the number is fixable once you stop treating callbacks as random and start treating them as a signal. Here is how to read yours and bring it down.
At its simplest, the callback rate is the percentage of completed jobs that require an unplanned return to correct something. It is the one quality metric a customer experiences directly, which is what makes it so revealing. You can tell yourself your work is excellent, but the callback rate counts the times reality disagreed. A low and falling number means your process is sound; a rising one means something upstream — diagnosis, parts, or workmanship — is slipping.
The financial damage is larger than the lost hour. A callback delays the next paying job, burns fuel and goodwill, and often arrives with a customer who is now skeptical instead of grateful. Consequently, lowering your callback rate is one of the highest-return moves available to an independent plumber, because it improves cash, schedule, and reputation at the same time.
Callbacks are rarely mysterious once you sort them by cause. Most trace back to a handful of repeatable failures, and each has a specific fix. Track which bucket each callback falls into and the pattern — and the remedy — becomes obvious fast.
| Common cause | What it looks like | The fix |
|---|---|---|
| Misdiagnosis | Treated the symptom, missed the real fault | Slow the diagnostic; confirm before quoting |
| Wrong or weak parts | Part fails or does not fit on return | Standardize parts; log part numbers per job |
| Rushed workmanship | Fitting not seated, joint not tested | Test under pressure before leaving site |
| Unclear scope | Customer expected more than was quoted | Written scope; confirm what is and is not included |
If there is a single habit that lowers a callback rate fastest, it is testing the repair under real conditions before the truck leaves the driveway. Run the water, cycle the valve, check the joint under pressure, and watch for a minute. A leak you catch on site costs you two minutes; the same leak discovered by the homeowner that night costs you a return trip, an apology, and a dent in trust. Therefore the cheapest callback is the one you prevent while you are still standing there.
The formula is simple: divide the number of jobs that required an unplanned return by the total jobs completed in the same period, then multiply by 100. If you ran 80 jobs last month and went back on 6, your callback rate is 7.5 percent. The “good” number varies by the kind of work you do — heavy repair and old-house work naturally runs higher than straightforward installs — so the benchmark that matters most is your own trend line, not someone else’s average. A rate that drifts up two months running is the signal to act, regardless of where it started.
Consider a one-truck operator who felt his quality was fine until he actually counted. Six callbacks in a month did not feel like much — one here, one there — but at 80 jobs that was nearly one in thirteen coming back. When he tagged each one to a cause, four traced to the same brand of shut-off valve failing on reconnection. He switched the part, and the next month’s callbacks dropped to two. Nothing about his skill changed; he simply made an invisible pattern visible. That is the whole point of tracking the number: it turns a vague sense that jobs sometimes come back into a specific, fixable cause.
Lowering callbacks is a process problem, not a talent problem. A short, consistent close-out routine on every job catches the failures before the customer does. The list below is a starting point — adapt it to your work, but run it every time.
That last step is the one operators skip and the one that matters most. A callback you simply absorb teaches you nothing; a callback you tag to a cause becomes the thing you fix systemwide. Track the rate, sort the causes, and the number falls on its own. This is one chapter of the broader guide to building a plumbing business that is profitable, not just busy, and for where field quality is heading across the trade, the growth opportunities in sustainable plumbing reward the operators whose work does not come back.
The jobs you never have to redo
Your reputation is built on the jobs you never have to go back to.
Job history, photos, and parts logged on every ticket — so you can spot the pattern behind a callback instead of absorbing it and forgetting it.
External reference: Plumbing-Heating-Cooling Contractors Association (PHCC) — national trade body for plumbing operators in the United States.